
Thalinomics: Is the Thali Now Costlier?

Thalinomics – Economic Survey – Taxscan
Thalinomics – Economic Survey – Taxscan
Economic Survey of 2019-2020 has in its chapter included the study of the economics of a place of food in India to comprehend the inflation in relation to the same. A similar measure called ‘Dosanomics’ was employed by Krishnamurthy Subramanian’s predecessor and teacher Dr. Raghuram Rajan. Taking a cue, in order to capture the economics of a plate of food in India, the yardstick of thalinomics has found a chapter to its name in the Economic Survey of 2019-2020. Thalinomics is an attempt to quantify what a common person pays for a Thali across India. It analyzes by way of employing Thalinomics, the evolution of prices of food items during the period from 2006-07 to 2019-2020. It takes into account the components of the Thali which account for changes in the price of the same.
How is a Thali constructed for the study?
Thalis for the present study have been mentioned to be constructed using the average monthly price data (used for the preparation of Consumer Price Index-Industrial Workers (CPI-IW)) for the period April 2006 to October 2019 from Labour Bureau, Government of India, for 78 centers in 25 States/UTs. The average monthly prices of various commodities are averages of the open market prices of a specified variety of an item prevailing in the selected outlets in the selected markets in a given center.
Two types of Thali were considered for the analysis: a vegetarian Thali and a non-vegetarian Thali. The quantities of constituents required for the preparation of a Thali were based on the dietary guidelines prescribed for Indians (NIN, 2011).
The quantities for cereals, vegetables, pulses, and non-vegetarian items for each Thali have been taken assuming that at least two full meals would be consumed in a day such that the daily dietary requirements for these elements would be met.
Initiatives towards maintaining the Productivity of agriculture and efficiency of agricultural markets
The Survey then highlights some major initiatives for enhancing the productivity of agriculture and efficiency of agricultural markets taken by the government while awarding the same the credit of decrease in thali price by stating:
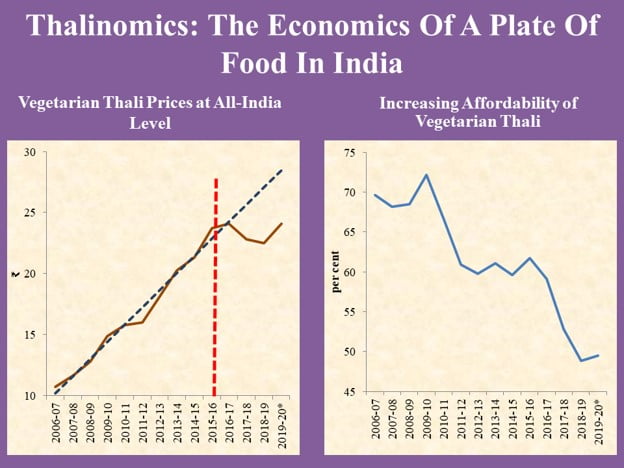
“This is reflected in a slowdown in the prices of thalis at the all-India level”
These inter alia include:
| S. No. | Scheme | Year |
| 1. | Pradhan Mantri Annadata Aay SanraksHan Abhiyan (PM-AASHA) | Launched in 2018 |
| 2. | Pradhan Mantri Krishi Sinchayee Yojana (PMKSY) - Per Drop More Crop | implemented in the year 2015-16 |
| 3. | Pradhan Mantri Fasal Bima Yojana (PMFBY) | introduced in 2015-16 |
| 4. | Soil Health Card | introduced in the year 2014- 15 |
State-wise affordability of the Thali
The survey highlights state-wise affordability rates of the Thali for the present analysis to conclude that “the most affordable Thali was in Jharkhand; two vegetarian Thalis for a household of five in Jharkhand required about 25 percent of a worker’s daily wage. Non-vegetarian Thali was also the most affordable in Jharkhand (Figure 7). Comparing between 2006-07 and 2019-20 (April-October), vegetarian Thali has become more affordable in all states under consideration. In the case of non-vegetarian Thali, affordability has increased during this period in all states except Bihar and Maharashtra, where it has shown a marginal decline.”
Thali Inflation
It has been noted that while thali inflation remained elevated during the initial period under review, it has shown significant reduction thereafter. While admitting inflation in the year 2019-2020, it mentions that the same is a temporary phenomenon that should fall back as was in earlier years. The prices of Cereals have been mentioned to be declining at a steady rate, the inflation has accelerated in all other components except sabzi.
Conclusions in light of Thalinomics
Reiterating the fact that the absolute prices of a vegetarian Thali have decreased significantly since 2015-16 but increased in 2019, the survey states that “an average household of five individuals that eats two vegetarian Thalis a day gained around `10887 on average per year while a non-vegetarian household gained `11787, on average, per year. Using the annual earnings of an average industrial worker, it is found that affordability of vegetarian Thalis improved 29 percent from 2006-07 to 2019-20 while that for non-vegetarian Thalis improved by 18 percent.”
A comparison has been drawn with the trend till 2015-16 wherein it has been stated that after 2015-16, the average household gained `10887 per year on average from the moderation in Thali prices.
While the government has employed this recently emerged standard to analyze the inflation of food items specifically focusing on the items a common person intakes and keeping into account the parameters of regions, preferences of a non-vegetarian meal while distinguishing it from a vegetarian one, the effectiveness of the same is yet doubtful.